导读
在海洋遥感设备和海洋探测技术飞速发展的大环境下,高精度海洋数据得以广泛收集并计算,而高精度的海洋数据具有体量大、时变性强等特点,且在海洋深度上分布不均。这样的数据给海洋探索带来了广阔空间,但也给海洋可视化带来了巨大挑战。海洋可视化是观测海洋现象、提取海洋特征、预测海洋事件、提供决策支持的主要方式之一,不断与时俱进地更新并升级可视化框架,对于海洋的探索和分析具有重要意义。

图1 图文摘要
主要内容
海洋现象对热传输、物质传输和气候形成有重大影响,而分析海洋数据对于理解和预测海洋现象又至关重要。例如,海面温度和洋流可以预测厄尔尼诺和拉尼娜事件的发生及其对于全球气象的重大影响。
对于近些年来海洋数据量呈爆炸式增长的状况,本研究提出了一种新的分析框架,用于大型海洋标量体积数据的可视化。如图2所示,首先选择海洋标量场数据,然后将其转换为TIFF格式。其次,设计了一种新的基于GPU的光线投射算法来渲染海洋体数据。为了让用户观察到详细而动态的海洋现象,添加了一个内部漫游算法来观察海洋数据的内部结构,并设计了深度校正算法来适应海洋体积数据的特点。并且,设计了一种加速方法来平衡渲染质量和渲染速度。最后,开发了一个用于交互式可视化海洋体积数据的传递函数。

图2 可视化框架
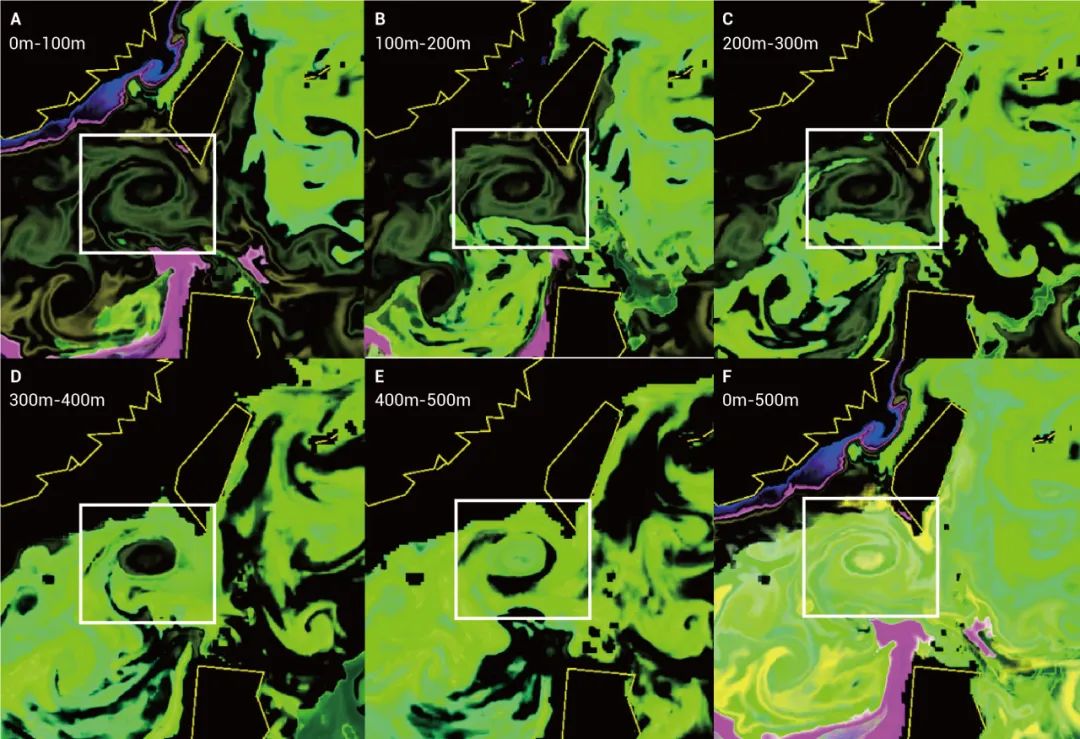
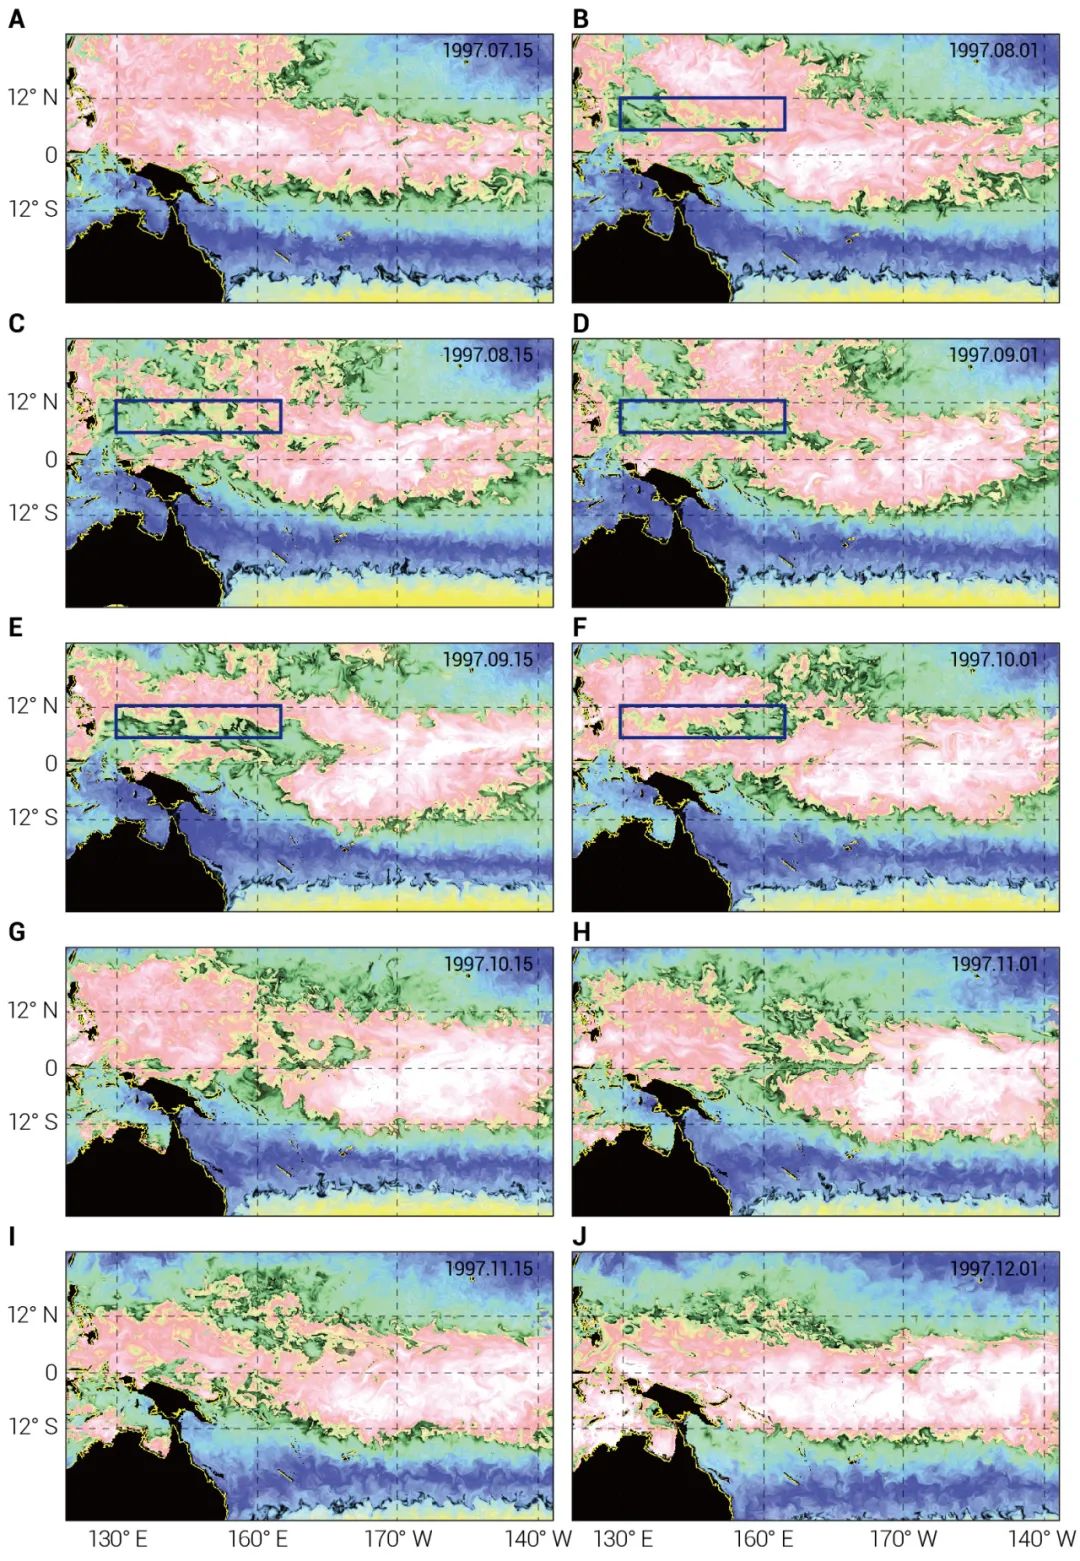
本文将框架中展示的南海数据(即温度和盐度)与黑潮之间的关系与现有方法中的结果进行了比较,可见图3和图4。此外,通过使用混合坐标海洋模型(HYCOM)数据和Argo数据可视化西太平洋暖池的边界和热中心,如图5和图6所示,评估了框架的适应性。

图3 南海北部海域温度分层

图4 南海北部海域盐度分层

图5 西太平洋暖池中心

图6 西太平洋暖池分裂
总结与展望
海洋可视化对于认识海洋、分析海洋、探索海洋、预测海洋具有重要意义,是揭开海洋神秘面纱的重要技术。本研究对于海洋可视化进行了一些尝试,在以后的工作中,还将重点改进数据预处理阶段和可视化阶段,以增强使用该框架的用户体验。并且尝试加入基于深度学习的传递函数来探索更友好的可视化系统。
原文链接:
https://spj.science.org/doi/10.34133/olar.0014
文章标题:
A Visual Analytics Framework for Ocean Scalar Volume Data
文章作者:
Jinyu Li, Tianyi Huang, Ping Hu, Weicheng Cui and Shenghui Cheng
文章摘要:
The processes and phenomena hidden in massive marine data importantly impact heat transportation, material transportation, and climate formation. Visualization can assist people in mining and understanding marine data to gain insight. Thus, oceanographers must study ocean processes and phenomena. However, one remaining challenge in the existing visualization methods is efficiently rendering marine data with large volumes and illustrating the internal structure of marine phenomena. To solve this problem, we propose a new visual analytics framework involving 4 parts for visualizing extensive marine scalar volume data. We first use a single box and double spheres separately as proxy geometries to draw a flat Earth and spherical Earth. Second, we design a new ray-casting algorithm based on graphics processing unit to reduce the volume of marine data. This algorithm accelerates volume rendering by using an adaptive texture sampling rate and step size. Third, we use a depth correction algorithm to accurately restore the ocean scale. Finally, we develop an internal roaming algorithm to observe the internal structure of marine data. In this way, users can dynamically observe the internal structure of marine phenomena. To illustrate the effectiveness of our algorithms, we use them to visualize Hybrid Coordinate Ocean Model data and Argo data.
文章引用:
Li J, Huang T, Hu P, Cui W, Cheng S. A Visual Analytics Framework for Ocean Scalar Volume Data. Ocean-Land-Atmos. Res. 2023;2:Article 0014.
https://doi.org/10.34133/olar.0014


OLAR 期刊简介
Ocean-Land-Atmosphere Research (OLAR) 由南方海洋实验室和美国科学促进会合作出版,入选2022年度中国科技期刊卓越行动计划高起点新刊项目,是海洋负排放国际大科学计划(Ocean Negative Carbon Emissions, ONCE)指定的官方唯一合作期刊。期刊以“服务科学研究,推动技术创新”为办刊宗旨,坚持发表高质量、高水平论文,力争成为具有较大影响力的国际一流学术期刊。本刊以海洋相关学科为重点,刊稿主题包括但不限于:海陆气相互作用、海洋碳中和、物理海洋学、海洋生物与生态、海洋地质与地球物理、化学海洋学、海洋气象学、大气物理与大气环境、冰冻圈科学、河口海岸学、海洋工程与海洋技术、海洋资源开发与利用。OLAR 投稿系统目前已正式开放,热烈欢迎相关研究领域科学家踊跃投稿。分享卓见,探索前沿,OLAR 诚邀您一起荟萃科学发现,共享学术盛筵!
期刊官网:
https://spj.science.org/journals/olar/
投稿系统:
https://www.editorialmanager.com/olar/

扫码关注OLAR官方公众号


