The South Asian summer monsoon (SASM) exhibits significant variations in rainfall and atmospheric circulation on a wide range of time scales. The interannual variability of SASM rainfall not only affects the lives of more than one billion people, but also regulates local and remote atmospheric circulations by releasing diabatic heating. Mitigation is possible with timely and accurate prediction of the monsoon. Unfortunately, the SASM is notoriously to predict, in particular for the recent decades. Specifically, for the All India Rainfall Index, the correlation skill of the official operational forecasts made by the Indian Meteorological Department statistical models during 1989–2012 is only -0.12 (Wang et al. 2015). Is the SASM really unpredictable?
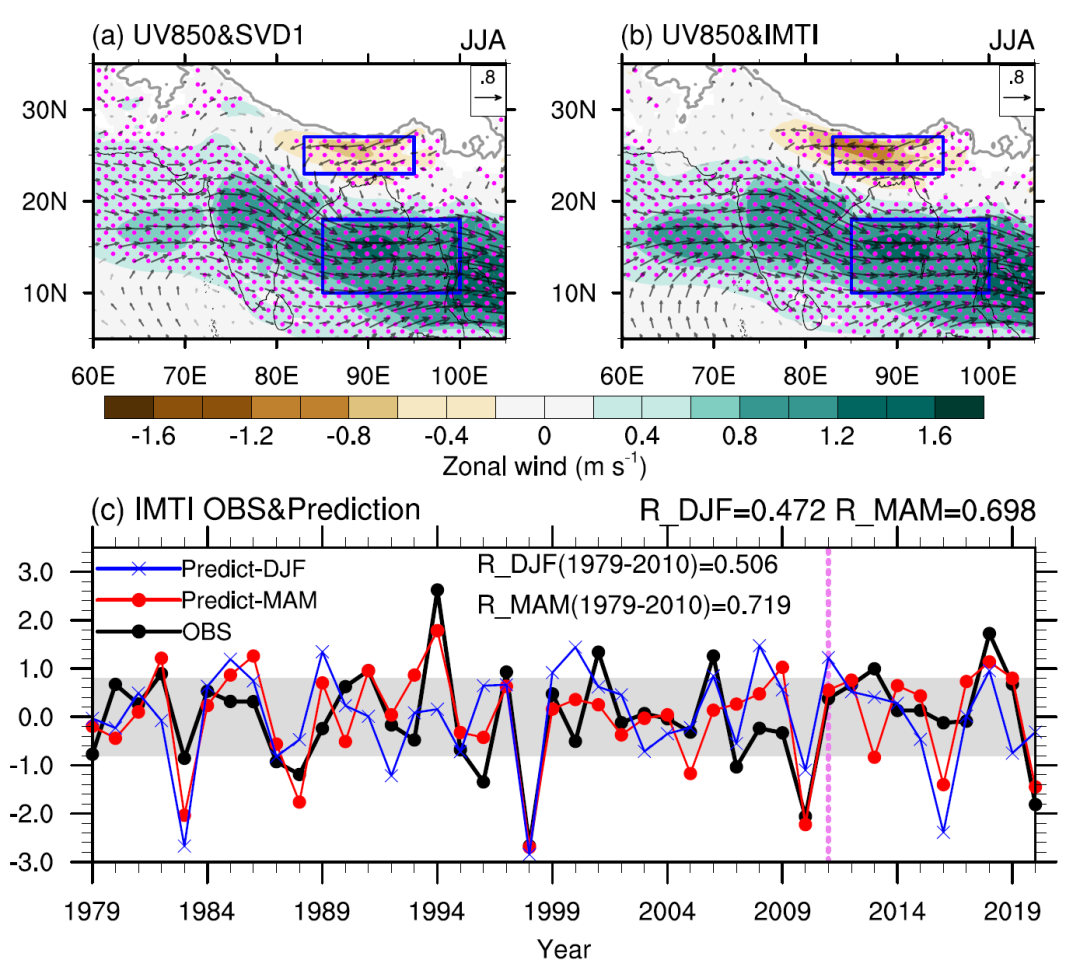
By identifying two dominant modes of the SASM, the Innovation Team for Ocean-Land-Atmosphere Interaction and Global Effect of the Southern Marine Science and Engineering Guangdong Laboratory (Zhuhai) reveals that the unsatisfactory prediction of the SASM during the recent decades is probably because the existing monsoon indices are mostly related to the less predictable second mode. The first mode, on the other hand, is highly predictable. It is physically linked to the variation of the Indian monsoon trough coupled with large rainfall anomalies over the core monsoon zone and the northern Bay of Bengal (Figures 1a-b). An index is constructed as a physical proxy of this first mode, which can be well predicted one season in advance, with an overall skill of 0.698 for 1979-2020 (Figure 1c). The study points out an excellent predictable prospect of the SASM, which has been neglected in previous studies.

Figure 1: Definition and prediction of the Indian monsoon trough index (IMTI). Regressions of 850-hPa wind (m s-1; vector) against (a) the first principal component (PC1) of rainfall and (b) IMTI. (c) Time series of the standardized IMTI in observation (black curve) and that predicted by the sea surface temperature over the eastern tropical Indian Ocean (TEIO_SST) and tropical Atlantic (TA_SST) in preceding spring (red curve) and by Niño-3 index in preceding winter (blue curve). In (a-b), shading denotes zonal wind. Significant values exceeding the 95% confidence level are marked by magenta dots or black vectors. The blue boxes outline the regions for the definition of the IMTI. In (c), “R_DJF” and “R_MAM” represent the correlation coefficients of observed IMTI with inferred IMTI by Niño-3 index and by the TEIO_SST and TA_SST for 1979-2020, respectively. “R_DJF(1979-2010)” and “R_MAM (1979-2010)” represent the correlation coefficients for 1979-2010. The vertical dashed line denotes the line of demarcation between the training period (1979-2010) and prediction period (2011-2020). Observed values within the gray zone (absolute values ≤ 0.8) represent the normal years; and those below and above the gray zone are for the negative and positive years, respectively.
This work entitled “A predictable prospect of the South Asian summer monsoon” has been published on Nature Communications in November 2022. Dr. Tuantuan Zhang and Dr. Song Yang from the School of Atmospheric Sciences of Sun Yat-sen University and the Southern Marine Science and Engineering Guangdong Laboratory (Zhuhai) are respectively the first author and the third author. Dr. Xingwen Jiang is the corresponding author, and Dr. Junwen Chen and Dr. Zhenning Li are coauthors.
This study is jointly supported by the Southern Marine Science and Engineering Guangdong Laboratory (Zhuhai), the National Natural Science Foundation of China, the Guangdong Province Key Laboratory for Climate Change and Natural Disaster Studies, and Sun Yat-sen University.
Paper link:
https://www.nature.com/articles/s41467-022-34881-7


